Blog | Goals oriented planning

In the early days of Mihaly Slocombe, we had no idea how to plan.
We knew what needed doing, on what projects, and in what order, but we never attempted to put it all together. We had no conception of short cycle planning, of how to line up tasks each month to achieve a setlist of goals. This essentially meant that we had no tools to help us achieve consistent cashflow. Instead, we arrived at the end of each month and only then figured out how much we were able to invoice. It was a lottery, and not often successful.
But then we encountered goals oriented planning, and it was if we had emerged for the first time from Plato’s cave, dazzled by the sun.
The idea is pretty simple:
- At the start of each month, we calculate our wages, overheads and profit.
- We arrive at an invoicing target that keeps Mihaly Slocombe afloat for another month.
- We determine which milestones we need to reach on which projects to enable us to invoice this target.
We changed from doing the work first and working out the money second, to working out the money first and doing the work second.
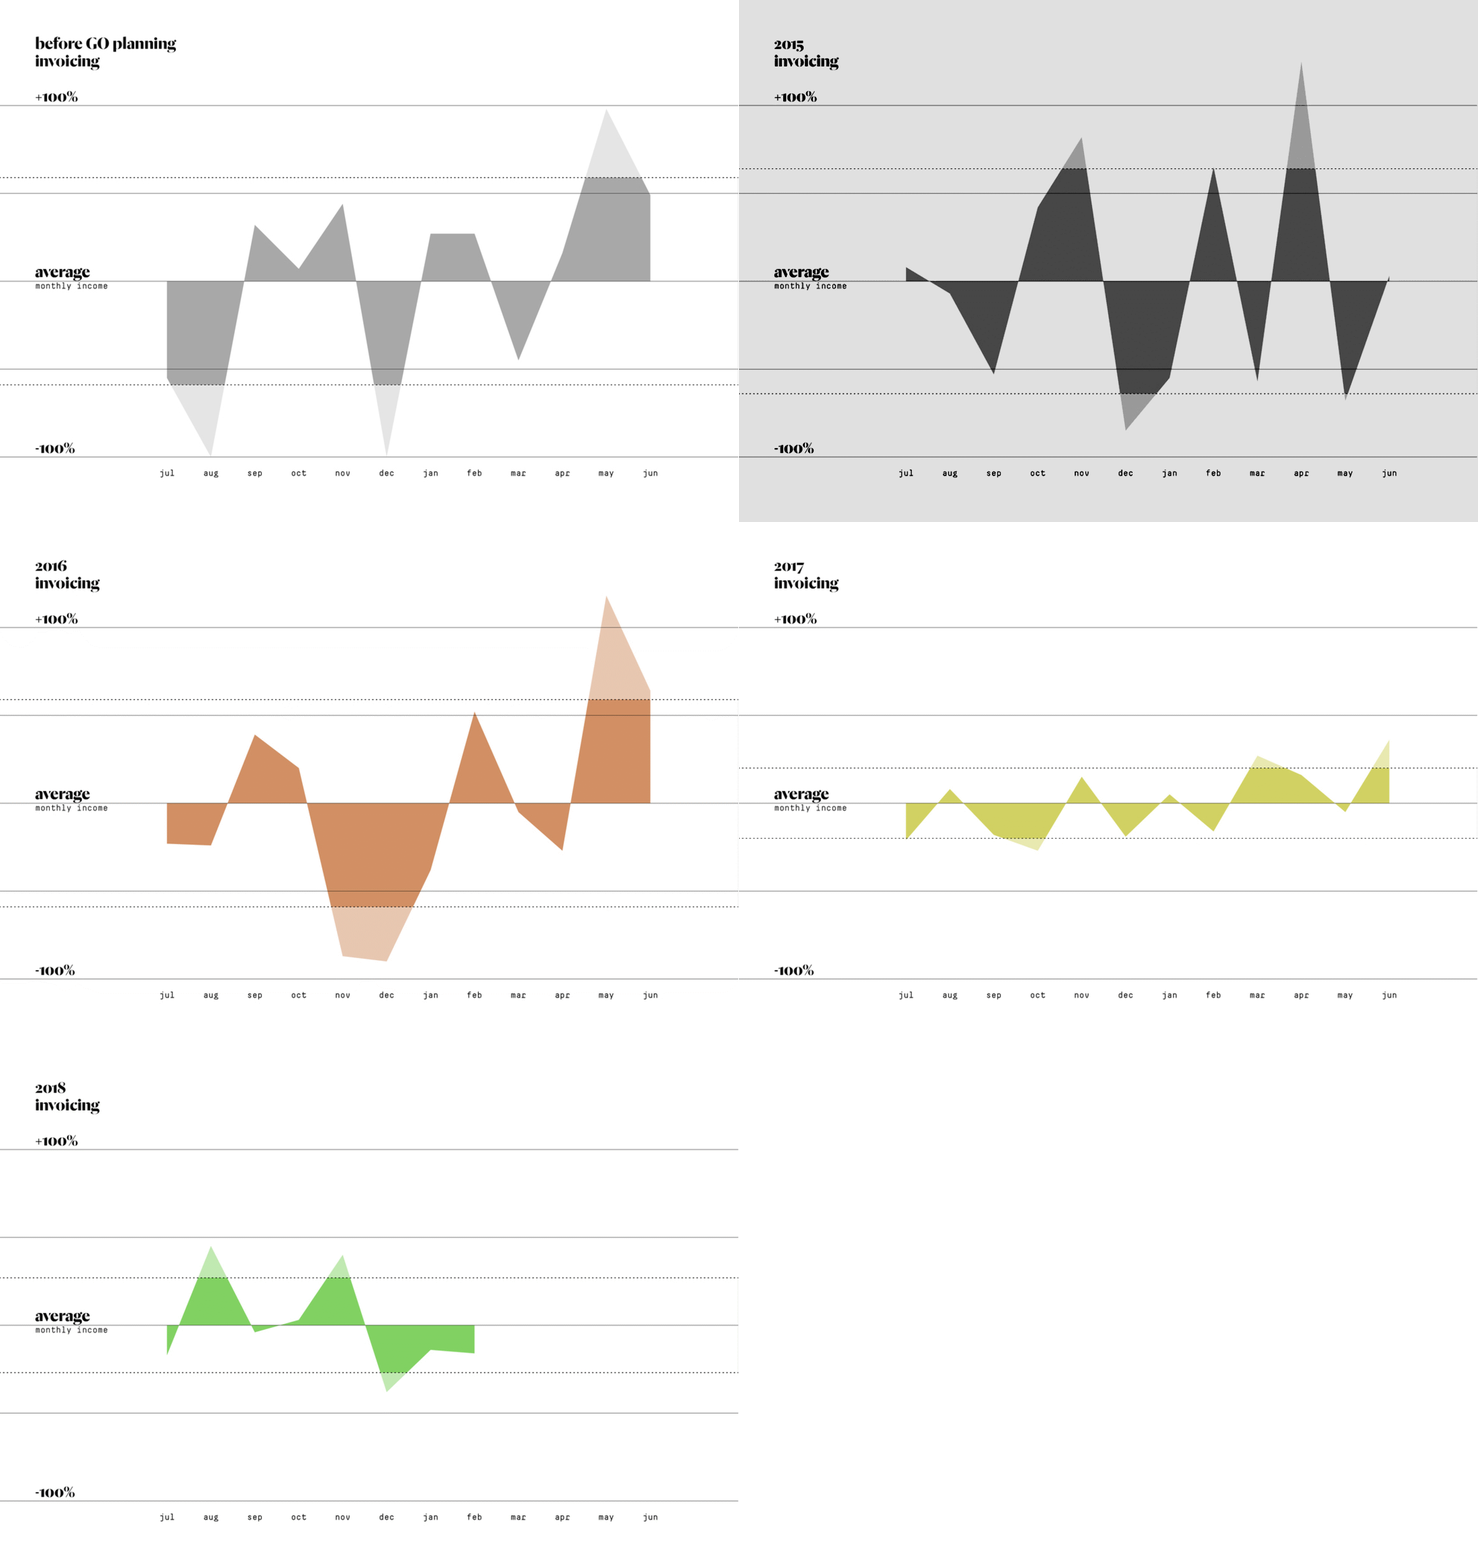
As I discussed in a pair of Panfilo articles three years ago (you can read them here and here), our adoption of goals oriented planning was very successful, measurably so. In the year prior to GO planning, our most and least lucrative months were +127% and -100% of our annual invoicing average. In the year following, we dramatically reduced this bandwidth down to +48% and -54% of our annual average. In other words, we got much better at stabilising our cashflow.
Three years on, I’m intrigued to find out whether this trend has continued:

It has continued pretty well it seems.
The 2015 and 2016 financial years were still pretty spikey, but 2017 and 2018 have become much narrower. With the exception of a few big peaks and troughs (most notably November and December 2015, when we pretended to be builders and renovated our studio), we now typically invoice within +/- 40% of our annual averages.[1] 2017 was particularly good, with all months within +36% and -27% of our average.
It’s worth noting that over this time period our studio has tripled in size, which has contributed to the narrowing trend (a sole practitioner panics when she invoices $5,000 less than she did last month, but a $5,000 dip barely registers for a large studio with $1m monthly turnover). But overall, the early promise of GO planning has proven sustainable.
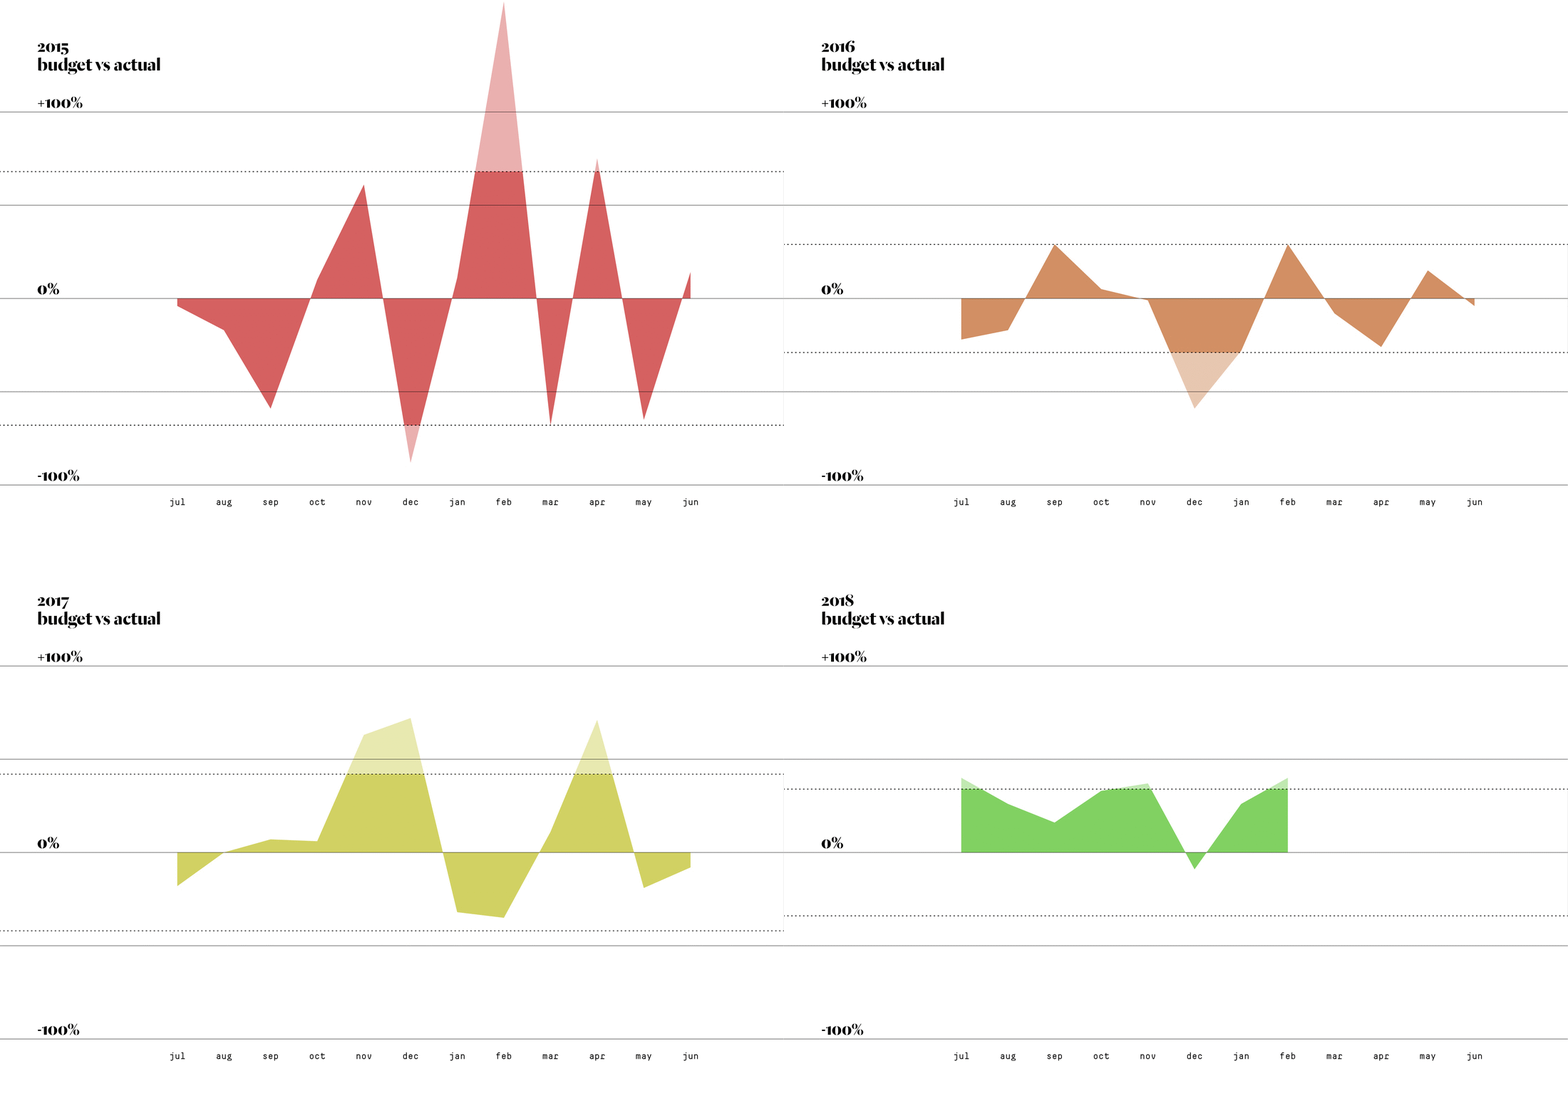
What about the forecasting itself? How consistent are we at getting through the work we plan?

Again, not too shabby.
It looks like we were still getting the hang of it in 2015, but ever since we have reliably invoiced within +/- 40% of our forecasts. 2018 has been a cracker so far, with all but one month proving more lucrative than initially expected. Also reassuring is that across the four years, we almost never see more than two below-forecast months in a row.
Now here’s where I geek out on some amateur statistical analysis. If you were wondering what the dashed lines and two-tone colouring mean on the infographs, then this part is for you. Alternatively, if the very mention of statistics turns your brain into jelly, please feel free to skip to the next section.
Here goes…
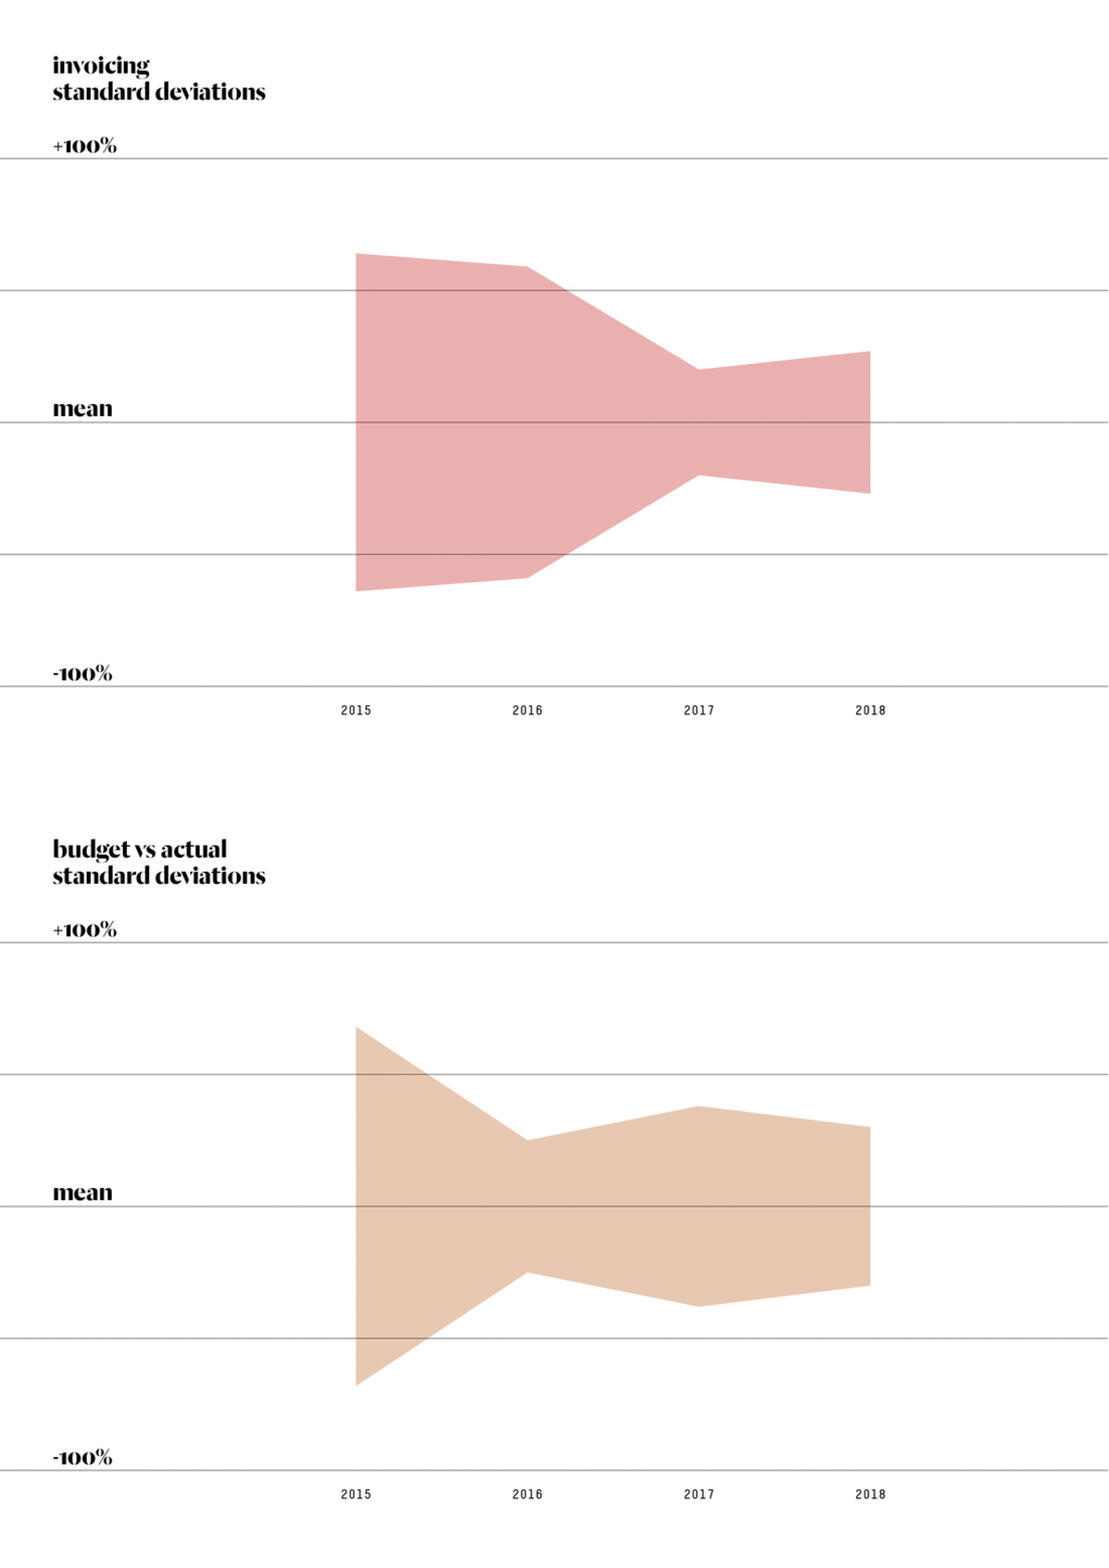
The dashed lines indicate one standard deviation from the mean. The more strongly coloured data points fall within one SD and the lightly coloured points outside. The mean is recalculated each year to ensure I’m not comparing our performance today with a team of seven to our performance three years ago with a team of two.
But what’s a standard deviation I hear you ask? Essentially, it measures how much our monthly invoicing and forecasting differ from our annual averages. The bigger the standard deviation (and more widely spaced the dashed lines), the more volatile our invoicing and forecasting.[2]

This is another way of looking at the above infographs. It reveals that with practice we’re getting better at goals oriented planning. Like anything, the repetitive action of setting monthly invoicing targets is helping us get better at setting monthly invoicing targets. This is good news for Mihaly Slocombe.
And we’re done with the statistics mumbo-jumbo. The jellyheads may return.
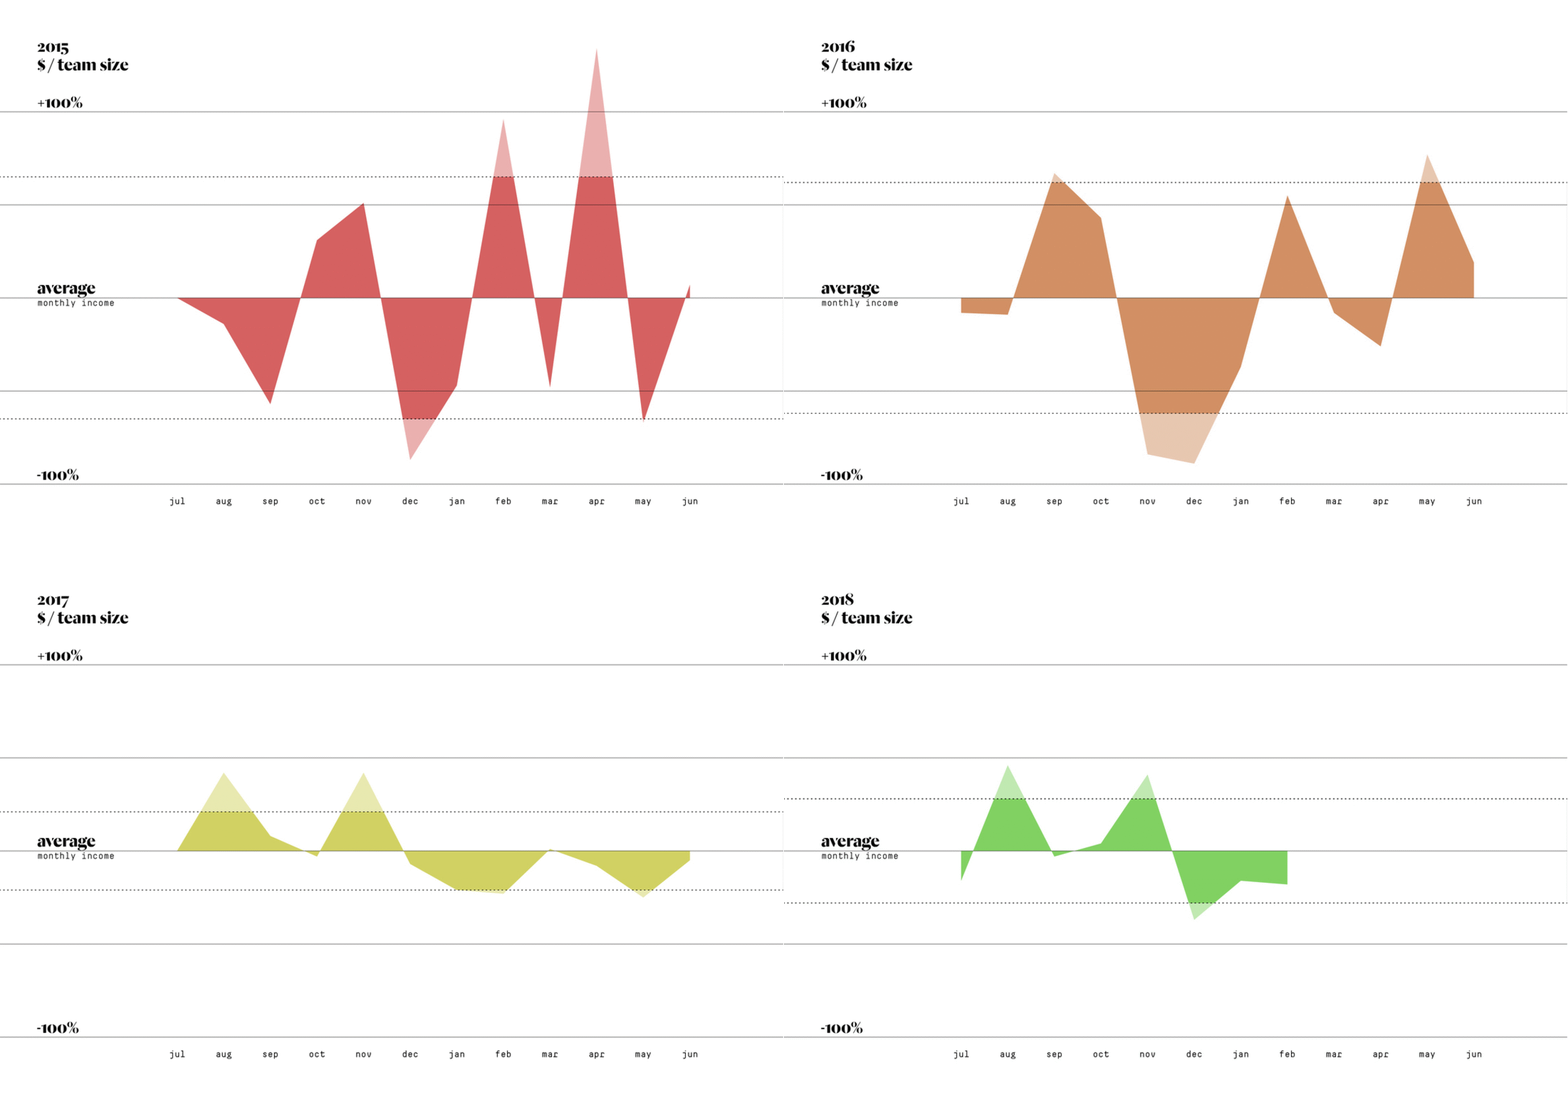
Assembling all this data made me curious about our growth. I mentioned above the normalising effect of a larger team – the more work we do each month, the less likely we are to have wild swings in our invoicing. Would a more granular look at our performance, one that’s corrected for the changes in our team size, confirm this?

Yep, it does.
In 2015 and 2016 we completed around 180 billable hours each month. Last year we completed around 360, and this year we’ve so far completed around 560. The big jumps in the last two years are surely correlated to the reduction in our invoicing bandwidth.
Of course, a perfectly flat income graph isn’t Mihaly Slocombe’s raison d’être. But it is something I value. It means that the effort we’re expending working on our business (rather than in it) is paying off. It also means that the hypothesis we had four years ago – that goals oriented planning would help make our business more commercially viable and sustainable – was correct.
Footnotes
- Average monthly incomes are recalculated for each financial year.
- In a large population distributed normally, 68% of all values fall within a band that’s +/- one SD wide, 95% of all values fall within +/- two standard deviations, and 99.7% of all values fall within +/- three standard deviations. It’s the pithily named 68-95-99.7 rule.
Images
- Goals oriented planning; author’s own image.
- Invoicing, before GOP to current; author’s own image.
- Budget vs. actual, 2015 to current; author’s own image.
- Standard deviations; author’s own image.
- $ / team size; author’s own image.